

#Module 6: Biostatistics-I
Spotter 1
Construct pie chart from the following data. (2) Male=40 Female=50 Transgender=10
Given data:
Male = 40
Female = 50
Transgender = 10
Step 1: Find total population
Total=40+50+10=100
Step 2: Calculate percentage for each category
Male: 40×100=40%
Female: 50×100=50%
Transgender: 10×100=10%
Step 3: Convert percentage to degrees for pie chart
Angle=Percentage×360/100
Male: 40×360/100=144∘40
Female: 50×360/100=180∘50
Transgender: 10×360/100=36∘10
Step 4: Draw the pie chart
Draw a circle.
Use a protractor to mark the angles from the center:
Male: 144°
Female: 180°
Transgender: 36°
Shade each section differently and label them.
Spotter 2
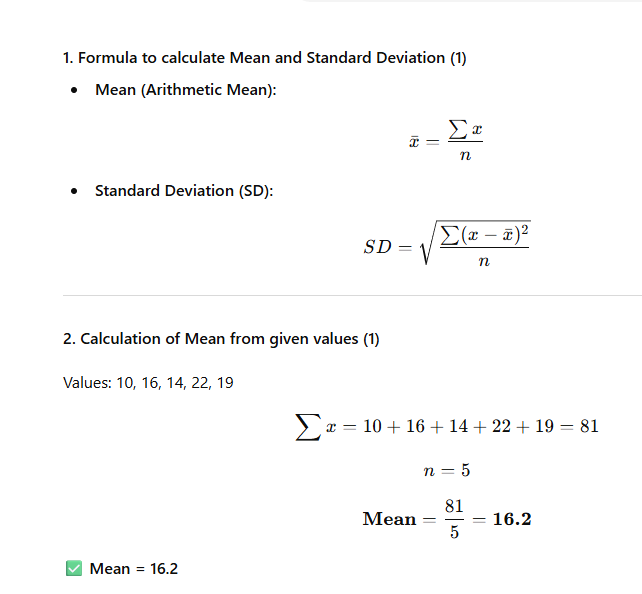
1. Write down the formula to calculate Mean and Standard Deviation. (1)
2.Calculate Mean from the given values (1):
Values: 10, 16, 14, 22, 19
Spotter 3
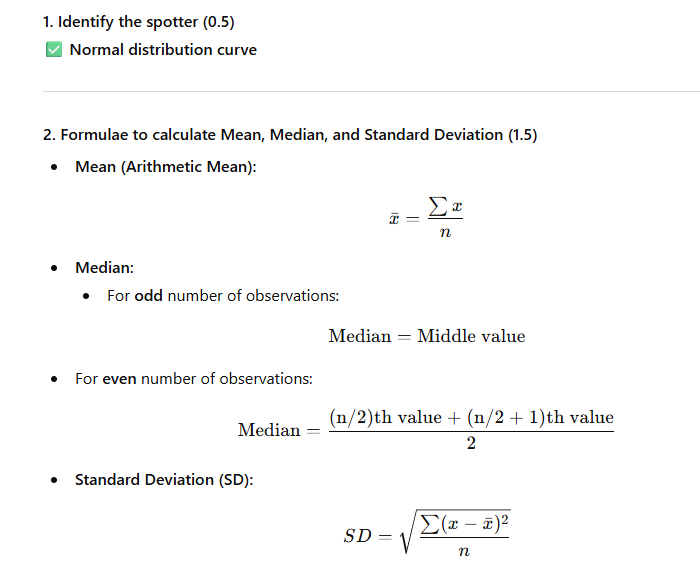
1. Identify the spotter. (0.5)
Normal distribution curve
2. Mention the formulae to calculate mean, median, and standard deviation. (1.5)
Spotter 4
1. Write the name of the given diagram. (1)
Pie Chart
2. Mention its application. (1)
Representation of categorical data as proportions or percentages of a whole
Useful for visualizing distribution of variables such as gender, age groups, occupation, or any other part-to-whole relationship
Commonly used in epidemiology, public health, surveys, and statistics to present data clearly and quickly
Spotter 5
1. Write the name of the given diagram. (1)
Histogram
2. Mention its application. (1)
Representation of continuous data using frequency distribution
Useful to visualize the shape of data, such as normal distribution, skewness, or variability
Commonly used in epidemiology, statistics, and research to show how often values occur within intervals